Related:
I was trying to figure this out myself and was going to ask a question to verify my results. Since this question is so close, I'll just post my results as an answer and comments/votes can help me figure out if it's correct!
I've been going by this tutorial on Adafruit which, unfortunately, doesn't talk about why they use a 10k Ohm thermistor paired with a matching fixed/bias resistor.
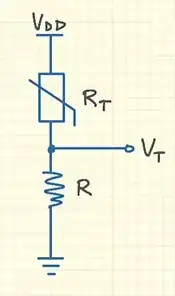
So we're on the same page, here's the circuit used (voltage divider, pic taken from the second related answer above):
The formula used to get from resistance to temperature (taken from the Adafruit guide, which uses the Steinhart-Hart equation):

Here's the full code used to find the temperature based on the voltage divider created by the fixed/bias resistor and the thermistor:
int pin_therm = A0;    // analog read pin
float reading;         // hold thermistor resistance
float stein;           // hold calculated temp

int res_fixed = 10000; // 10k fixed resistor
int res_therm = 10000; // 10k thermistor
int therm_nom = 25;    // nominal thermistor temp
int therm_b = 3950;    // thermistor B coefficient

reading = analogRead(pin_therm);
reading = (1023 / reading) - 1;
reading = res_fixed / reading;

// apply the S-H equation
stein = reading / res_therm;    // (R/Ro)
stein = log(stein);             // ln(R/Ro)
stein /= therm_b;               // 1/B * ln(R/Ro)
stein += 1.0 / (25.0 + 273.15); // + (1/To)
stein = 1.0 / stein;            // Invert
stein -= 273.15;                // convert to C
My aim is to measure around 150-250C, and I was curious what my resolution was after seeing very specific, "steppy" values when watching serial output. For example, as temps rose I'd see values like 202, 211, 222 but nothing in between.
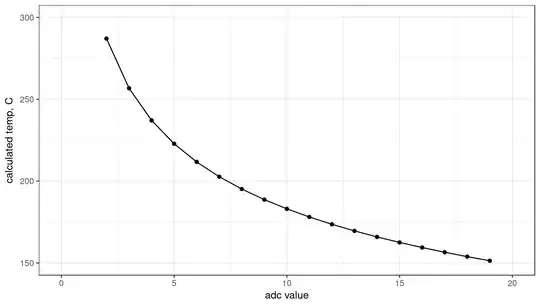
I used R to send all possible ADC values of 0-1023 through the equation to find the corresponding calculated temperature.
In my case, I modified the code above for the Honeywell 135-104LAG-J01 thermistor I was using (T = 25C, B = 3974). Using the rule of thumb to match the fixed resistor, here's what I get with 100k Ohms, showing ADC values for 150-250C. It revealed that this setup would only give me ~5 readings over 200-250C!
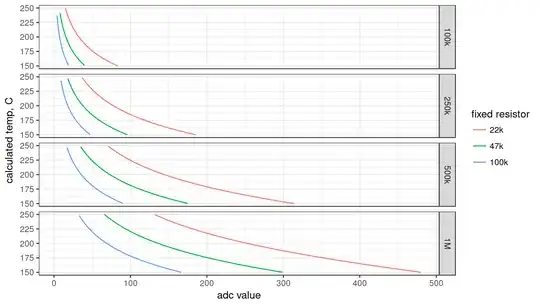
Going back to the math, it looked like I could drop the fixed resistance for better resolution. Here is the same 100k thermistor, but comparing the resolution obtained with 22k, 47k and 100k fixed resistors:

Using a lower fixed resistor, I have substantially more data points in my range of interest! We can simply compare the ADC ranges that make up this 150-250C span: ~20 for 100k and ~80 for 22k.
I'm not really worried about current consumption, but since it came up in the other answers, we can also increase the thermistor nominal resistance. Here's a plot breaking down by thermistor (100k - 1M) and matching fixed resistor (same 22k-100k values). I've removed the dots to make it less busy and the gray "mini-plot" titles are the thermistor values I looked at:
Lastly, to spare you from having to calculate the min vs. max ADC ranges covering the desired 150-250C range, here's a simple bar plot showing how many steps we get in this range.
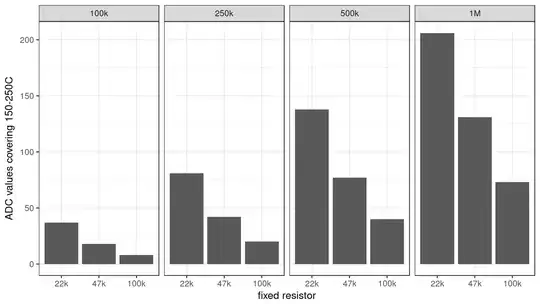
So, with a 1M Ohm thermistor and 22k fixed resistor, we could have ~0.5C resolution in this high range (100C span divided by ~200 ADC steps).
I echo the suggestion of John Taylor to plot things out, but in my case, the datasheet didn't list the key values required for his spreadsheet. I think spelling out the Adafruit code and putting my R code at the end can help understand how to do this (approximated) in order to compare temperatures of interest vs. ADC steps which cover it.
As a last aside, I ran into the mention of "source impedance" on one of the related questions. I'm not an electrical engineer, but some answers suggest that there may be a time delay issue with reading ADC values when the circuit resistance is very high:
That said, since I'm measuring high on the temp scale, an NTC thermistor will have less than max resistance. We're also helped by the fact that the equivalent resistance is:
1/((1/R_fixed) + (1/R_therm))
So, even with a 1M thermistor an 100k fixed, our equivalent resistance at room temperature is:
1/((1/1000000) + (1/100000)) = ~91k
This will only reduce further at higher temps, but I thought I'd mention it for the sake of thoroughness!
Here's the R code used to generate the multi plot covering 100k-1M thermistors vs. 22k-100k fixed resistors:
## for plotting
library(ggplot2)

## R kept wanting scientific notation, e.g. 10e5
options(scipen=10)

## range for ADC reading
inputs <- 0:1023

## create all combos of fixed resistor, thermistor, and ADC values
combos <- expand.grid(res = c(22000, 47000, 100000),
                      therm = c(100000, 250000, 500000, 1000000),
                      adc = 0:1023)

## make sure it's sorted the right way
## also, give it a unique identifier per combo
combos <- combos[order(combos$therm, combos$res, combos$adc), ]
combos$grp <- paste0(combos$res, "_", combos$therm)

## calculate the temps for each thermistor/fixed res combo
dat_lst <- lapply(unique(combos$grp), function(grp) {

  temp <- combos[combos$grp == grp, ]
  res <- unique(temp$res) / ((1023 / inputs) - 1)
  stein <- res / unique(temp$therm);
  stein <- log(stein);
  stein <- stein / 3974.0;
  stein <- stein + (1.0 / (25.0 + 273.15));
  stein <- 1.0 / stein;
  stein <- stein - 273.15;

  temp$temp <- stein

  return(temp)

})

## combine results
data <- do.call(rbind, dat_lst)

## some factor re-labeling to make plots more readable
data$res <- factor(data$res,
                   levels = c(22000, 47000, 100000),
                   labels = c("22k", "47k", "100k"))
data$therm <- factor(data$therm,
                     levels = c(100000, 250000, 500000, 1000000),
                     labels = c("100k", "250k", "500k", "1M"))

## reduce to only values in our range of interest
data <- data[data$temp > 150 & data$temp < 250, ]

## the plot itself
p <- ggplot(data, aes(x = adc, y = temp, colour = as.factor(res),
            group = grp)) + geom_line()
p <- p + scale_x_continuous("adc value")
p <- p + scale_y_continuous("calculated temp, C")
p <- p + facet_grid(therm ~ .) + theme_bw()
p <- p + scale_colour_discrete("fixed resistor")
p

## to save it out
png("./therm-vs-fixed.png", res = 200, width = 1600, height = 900)
p
dev.off()


